Business Insights
Why Smart Money Is Running Scared - 5 Warning Signs the Market Won’t Tell You
ANALYST'S PREFACE
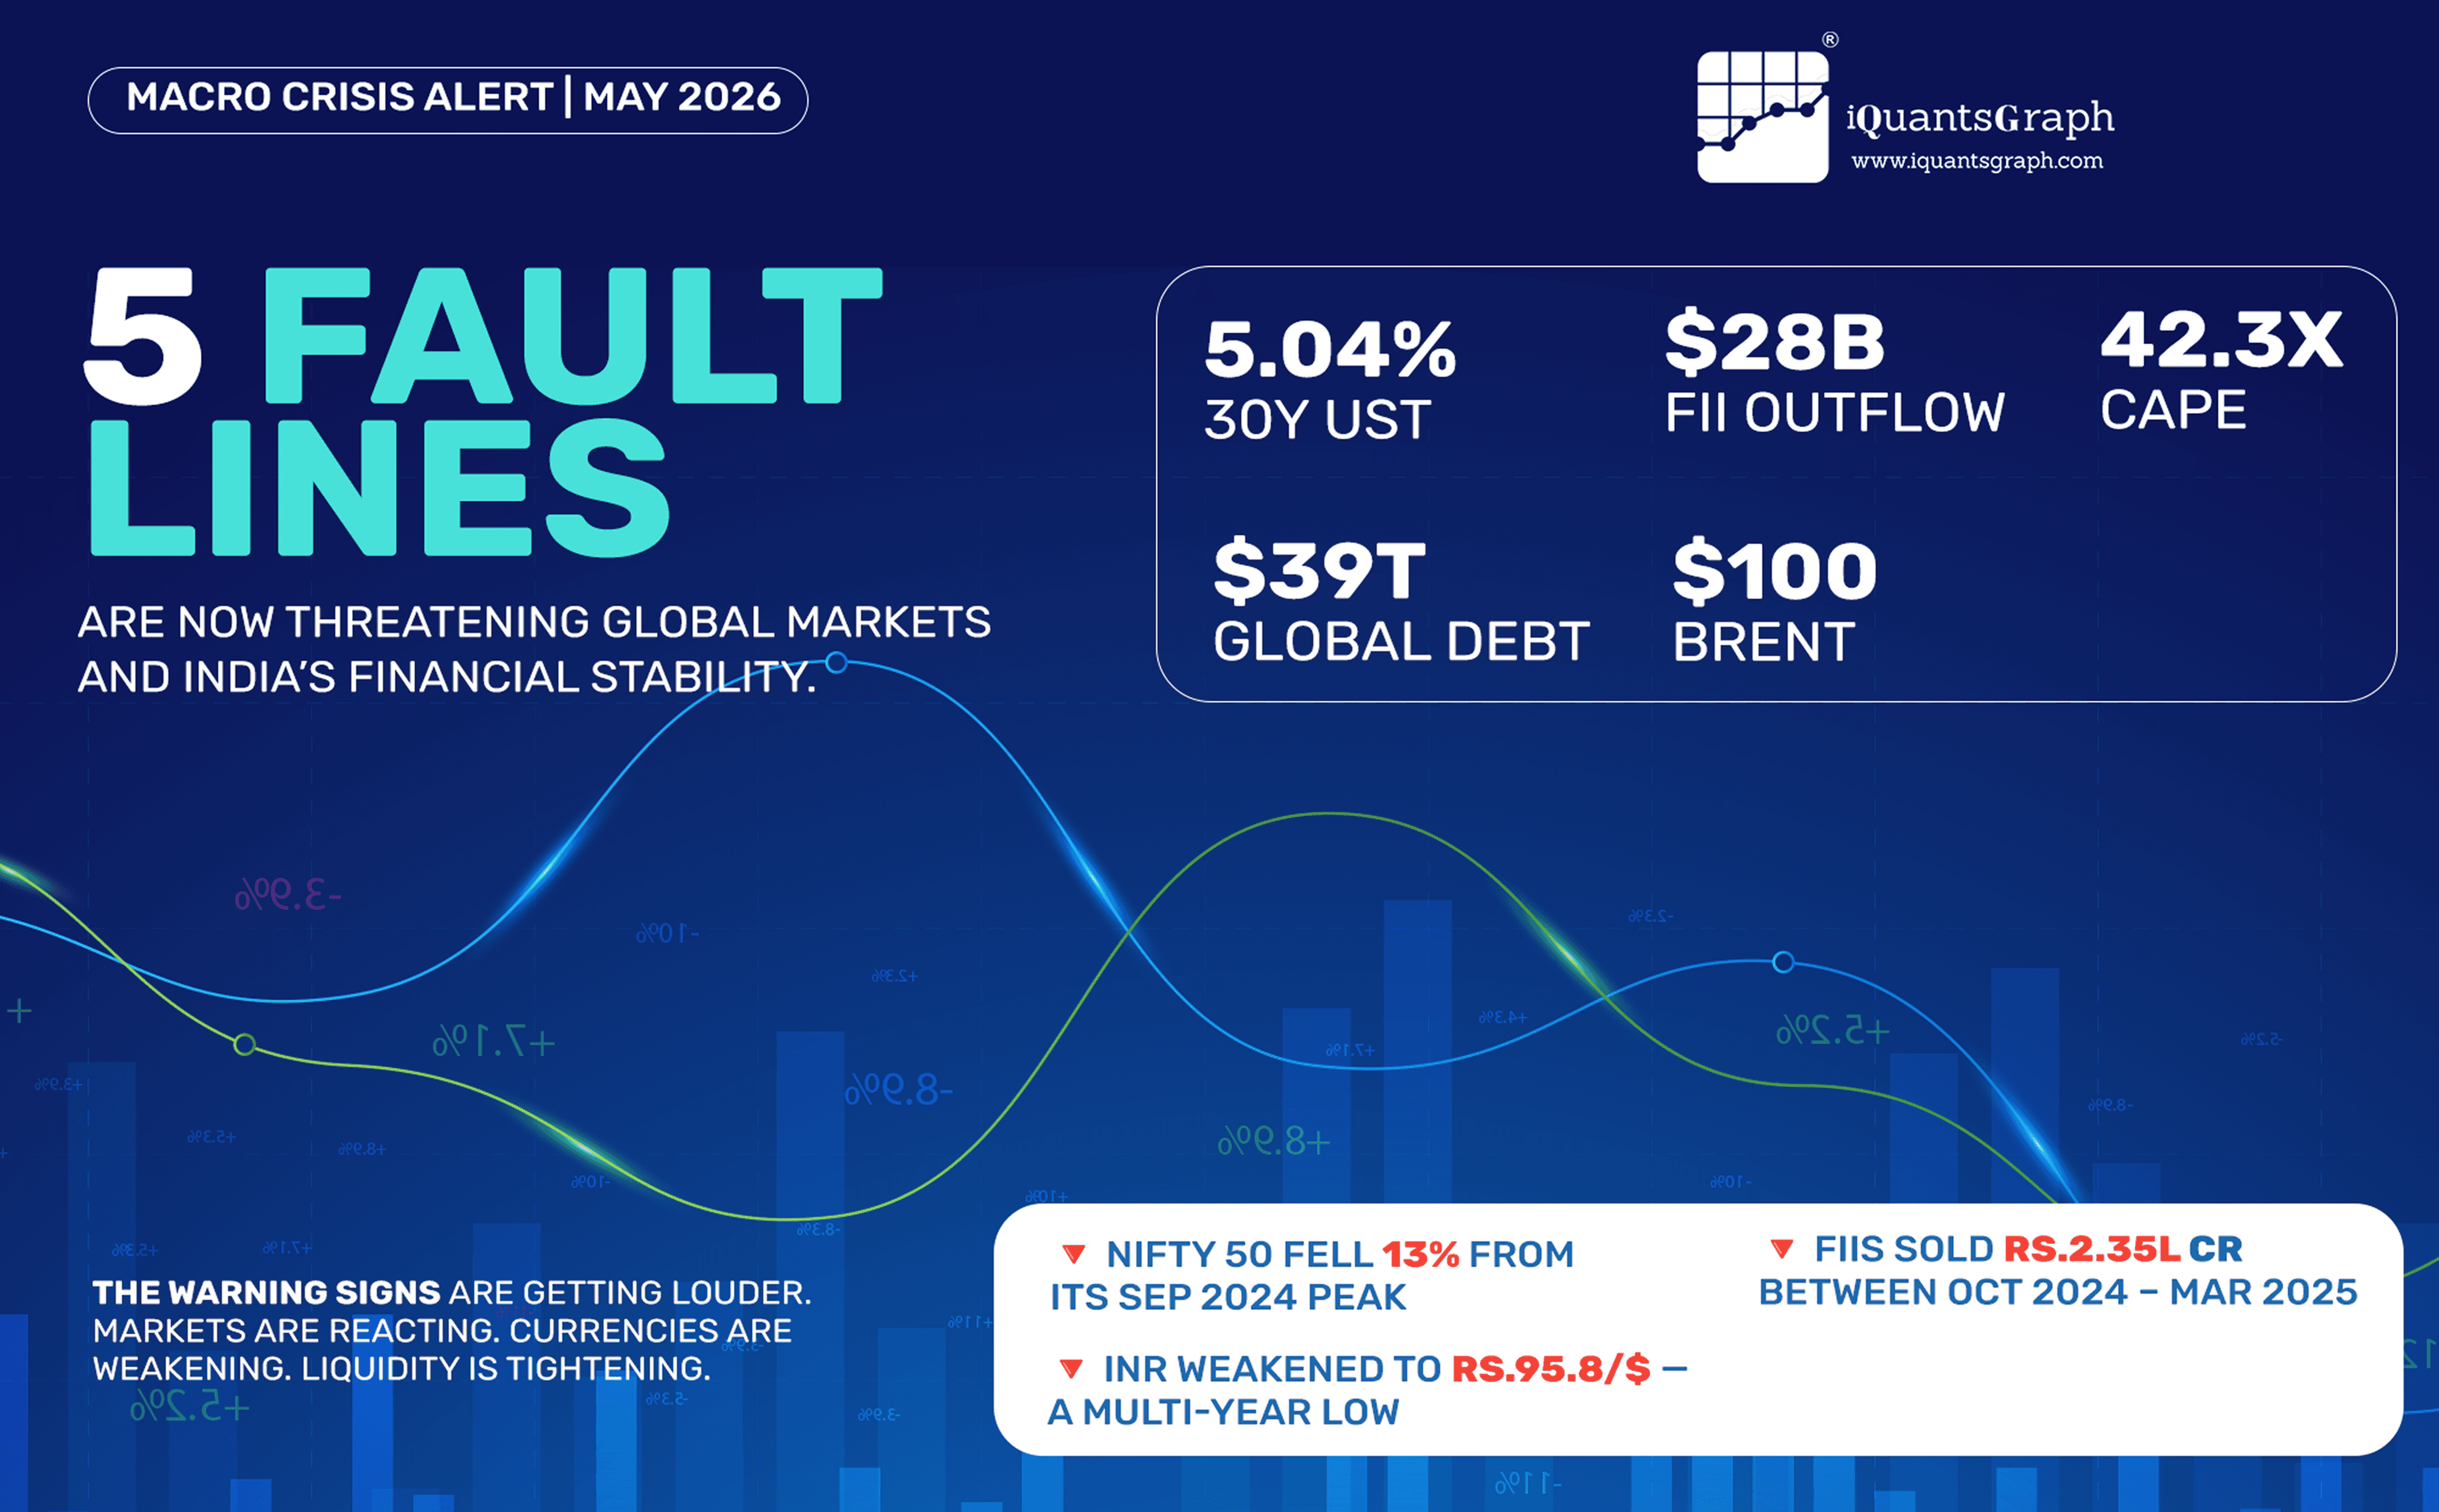
The global financial architecture is under stress from multiple simultaneous pressure points. Rising US yields, record FII outflows from India, extreme equity valuations, an unsustainable US debt burden, and surging crude oil prices are not isolated events — they are interconnected fault lines that amplify each other. This report examines each of these forces with the latest verified data, presents the analytical context, and explains what investors and corporates must understand right now.

1. THE BOND MARKET BREAKS 5%: THE US 30-YEAR TREASURY YIELD
The US 30-year Treasury yield has breached 5% — a level that sends shockwaves across every asset class globally. As of late May 2026, it stands at approximately 5.04%, the highest since the debt-scare episode of October 2023. This is not a minor data point. It is a fundamental repricing of the "risk-free" rate that underpins all global capital allocation.
To understand why this matters: every other asset in the world — equities, real estate, corporate bonds, emerging market debt — is valued relative to the risk-free rate. When a US government bond yields 5% in the world's reserve currency, the hurdle rate for every other investment rises proportionally. Money does not chase risk when safety pays handsomely.


KEY IMPLICATION FOR INDIA:
• Foreign portfolio investors who can earn 5% risk-free in USD have little incentive to absorb the currency risk of holding Indian assets at comparable or lower yields.
• Indian corporate borrowers who access global debt markets face higher refinancing costs.
• The "carry trade" that drove EM inflows for a decade is now structurally less attractive.
2. FII EXODUS: INDIA'S ₹2+ LAKH CRORE OUTFLOW CRISIS
From October 2024 through March 2025, Foreign Institutional Investors (FIIs/FPIs) sold approximately $28 billion (~₹2.35 lakh crore) worth of Indian equities — one of the largest sustained exodus events in India's capital market history. October 2024 alone saw a record ₹94,000 crore in net FII outflows, surpassing even the COVID-induced selling of March 2020.

The result was a 13% decline in the Nifty 50 from its September 2024 peak of 26,277 to a trough near 22,800. Multiple forces converged to trigger this sell-off:
• Elevated US bond yields making USD-denominated risk-free assets more attractive than Indian equities
• China's economic stimulus package in late September 2024 triggered a dramatic rotation from India to China — FIIs sold India to buy China
• Weak Q2 FY25 corporate earnings disappointing stretched valuations
• Sustained INR depreciation adding to the dollar-return drag for foreign investors

3. THE CAPE RATIO DANGER ZONE: US EQUITIES AT EXTREME VALUATIONS
The S&P 500's Shiller CAPE (Cyclically Adjusted Price-to-Earnings) ratio currently stands at approximately 42.3x — a level that places US equity markets in historically extreme overvaluation territory. The CAPE ratio, developed by Nobel Laureate Professor Robert Shiller, smooths earnings over a 10-year inflation-adjusted window to eliminate short-term distortions.

The historical context is deeply sobering:
• 1929 Great Depression peak: CAPE of 32.6 — we are currently 30% ABOVE that level
• 2000 Dot-Com Bubble peak: CAPE of 44.2 — we are dangerously close to the all-time record
• 2008 Pre-Financial Crisis: CAPE of 27.5 — today's reading is 54% higher than 2008 pre-crash levels
• Historical long-term mean: ~17.7 — current markets are trading at 2.4x the historical average

4. THE US DEBT SPIRAL: $39 TRILLION AND THE INTEREST TRAP
The US national debt has now reached approximately $39 trillion as of April 2026 — equivalent to roughly 123% of US GDP. More critically, the annual interest cost on this debt has surpassed $1.2 trillion in FY2025, making interest payments larger than the entire US defense budget. This is not just a fiscal concern — it is a structural market vulnerability.

The mechanics of the "interest trap" are as follows: when yields are high and the debt stock is enormous, even small changes in refinancing rates compound dramatically. Approximately 32–33% of US publicly held marketable debt matures within 12 months and must be refinanced at current elevated rates. This creates a self-reinforcing fiscal pressure:
• Higher debt service → larger fiscal deficit → more bond issuance → potential yield pressure → higher debt service costs
• If the Fed cuts rates to relieve this pressure, inflation risks re-emerge
• If the Fed keeps rates high, the debt spiral accelerates

5. CRUDE OIL SHOCK & THE RUPEE: INDIA'S DOUBLE WHAMMY
Brent crude oil has been trading above $100/barrel for much of 2026, touching a high of $138/barrel on April 7 as the de facto closure of the Strait of Hormuz tightened global energy supplies following geopolitical escalation in the Middle East. As of late May 2026, prices have eased to ~$96–100 as peace signals emerged, but the structural risk premium remains elevated.

India imports over 80% of its crude oil requirements. The arithmetic of high oil prices for India is brutal:
• Every $10/barrel increase in oil adds approximately $12–14 billion to India's annual import bill
• The current account deficit widens, putting structural pressure on the Indian Rupee
• At ~₹95.8/$ in May 2026, the Rupee has touched multi-year lows, increasing the cost of oil imports in rupee terms even further — a double-compounding effect
• Fuel prices and logistics costs feed through to core inflation, complicating RBI's monetary policy stance